


Climate
Our footprint
We are currently working on mapping our upstream scope 3 emissions to get a clearer picture of where we can make a difference. We have already identified electricity produced from renewable sources and secondary raw materials as possibilities where our sourcing plays a key role, but we hope to get more insights for further improvements.
Illustration of the ‘cradle to gate’ scope for Höganäs climate initiative and roadmap. As indicated by the data, materials sourcing is the largest contribution of emissions of carbon dioxide.

Direct carbon dioxide emissions, Scope 1
The use of fossil process coals and fuels in our own production is the largest source of direct carbon dioxide emissions (scope 1). In 2019, our total direct emissions were 256,200 (270,800) tonnes.
The decrease of almost 14,600 tonnes is due to lower production volumes, a number of investments that together have saved about 8,000 tonnes, and continuous energy efficiency improvements.
Natural gas accounts for 96 per cent of our emissions from non-renewable fuels, while the remaining 4 per cent are distributed through LPG, diesel and petrol.
| Carbon dioxide emissions from fuels and materials, tonnes CO2e | 2019 | 2018 |
| Emissions from fuels | 81,700 | 89,400 |
| Carbon in raw materials | 186,300 | 196,100 |
| - Carbon in waste | -10,500 | -12,900 |
| - Carbon in sidestream | -1,200 | -1,700 |
| - Carbon in products | -100 | -100 |
| Total | 256,200 | 270,800 |
The emissions from fuels are calculated based on local or alternatively, default emission factors from the EU-ETS framework. Emissions from raw materials in production processes are calculated based on carbon content and mass balance where the remaining carbon content in outgoing materials such as waste, side streams and products is deducted from the carbon content in incoming materials.
| Purchased energy, tonnes CO2e | 2019 | 2018 |
| Market based | 83,400 | 109,400 |
| Location based | 118,800 | 124,400 |
| Avoided CO2 emissions by choosing renewable energy | 35,400 | 15,000 |
| Total CO2 emissions (Scope 1 and Scope 2) | 339,600 | 380,200 |
Sources: IEA reported emission factors for residual mix electricity production, except for: Pennsylvania and New York State. “EPA Center for Corporate Climate Leadership regional data. Brazil “Ministry of Science, Technology, Innovation and Communication (MCTIC) and Belgium “Accord de Branche –CO2 mapping”,
Vattenfall (Sweden), Endesa Energía, S.A.U. (Spain), GSE (Italia) and Carbonfootprint.org.
Indirect carbon dioxide emissions, Scope 2
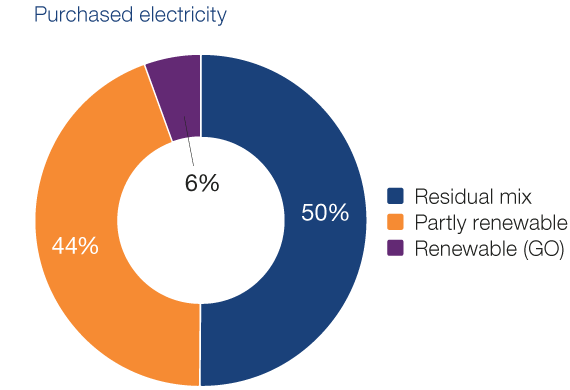
Our indirect emissions (scope 2) are from purchased electricity. Where available, the indirect emissions are calculated on location-based emission factors provided locally by owners of distribution nets or energy suppliers. As a comparison, we have also used a market-based calculation based on national residual grid mix factors.
Even though the individual companies within Höganäs have been free to choose electricity with a higher percentage from renewable sources, focus on alternative means of sourcing and producing renewable electricity will increase as part of our Climate Roadmap 2045. In 2019, we avoided emitting 35,400 (14,980) tonnes of carbon dioxide by actively choosing electricity from renewable sources. This is an increase from the previous year by 136 per cent.
Upstream reductions
We estimate that the main part of our total carbon footprint occurs upstream from our own operations in the production and transportation of the material that we use. If we can replace material with a large carbon footprint with material with lower carbon footprint, it could significantly change our overall total carbon footprint.
We are now mapping the footprint of our different materials to see where we can make changes. Virgin metals have a much higher carbon footprint than secondary metals of similar quality and composition. By increasing the use of recycled materials as raw materials in our production, we adapt to a circular economy and lower our total carbon footprint.

Transport
Over the last couple of years, we have worked to find a systematic and continuous approach to quantifying and minimizing the environmental impact of transport, including carbon dioxide emissions, in order to be able to see the effects of actions and changes over time. This is a challenge due to the number of different parameters to consider in every calculation.
However, in 2019 we have developed and trialled an upgraded system tool for calculating transport emissions. The results are promising and the methodology, data quality and usability will be evaluated during 2020. We are optimistic that we will be able to show progress and disclose results in the near future.