

Environment
Emissions to air and water
Air emissions
Our production processes generate air emissions both via stack and as fugitive emissions. Stable production processes and preventive maintenance of process equipment is key in avoiding both fugitive and stack dust releases.
To minimize stack emissions, all large point sources are equipped with filters. Local environmental control programmes typically include monitoring emissions such as nitric oxides (NOx), sulphur oxides (SOx), metals to air, and other substances of concern, depending on the nature of the process.
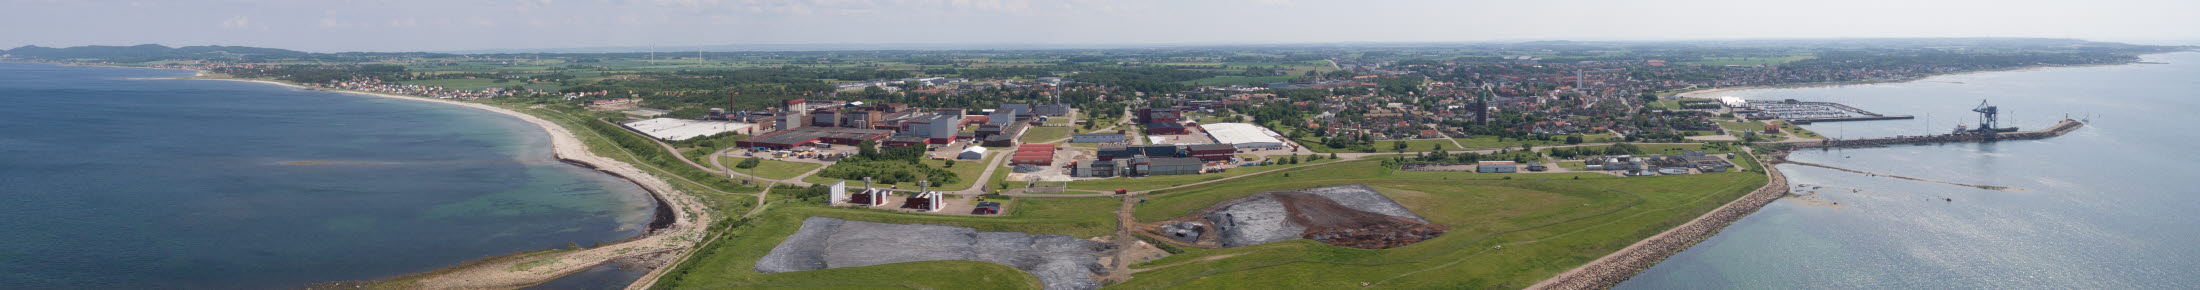
To prevent fugitive emissions, raw materials and products (metal powders) are handled in closed processes whenever possible. In-house storages and sealed transport containers of materials are used to prevent particles from spreading. However, the site in Höganäs, Sweden, bulk transports by ship where unloading must be done in the open.
Slag handling, including sorting and transporting to internal landfill, is generally carried out in open air at all slag production sites. Special procedures including watering, road sweeping, landfill covers, etc, are used to minimize emissions from the open handling. A combination of paved roads and working areas, and a programme for keeping the sites clean at all times, minimises secondary dust emissions.
| Air emissions, tonnes | 2019 | 2018 |
| Nitrogen Oxides (NOx) | 120 | 120 |
| Sulphur Oxides (SOx) | 40 | 40 |
| Carbon Monoxide (CO) | 120 | 140 |
| Non-Methane Volatile Organic Compounds (NMVOC) | 8 | 9 |
| Metal and dust emissions to air | 2019 | 2018 |
| Iron (Fe), kg | 9,800 | 11,600 |
| Chromium (Cr), kg | 7,610 | 9,000 |
| Zinc (Zn), kg | 1,050 | 1,500 |
| Nickel (Ni), kg | 580 | 110 |
| Copper (Cu), kg | 80 | 60 |
| Lead (Pb), kg | 70 | 70 |
| Cadmium (Cd), kg | 10 | 10 |
| Mercury (Hg), kg | 2 | 2 |
| Total dust, including metals to air, tonnes | 60 | 80 |
| PM10, tonnes | 40 | 45 |
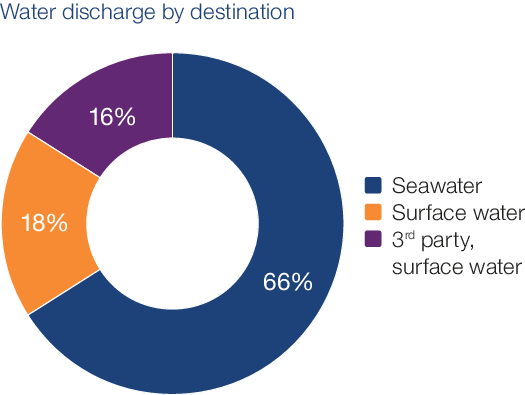
Water discharge
We need to continuously assess our water footprint and make sure we do not contribute to negative developments. We monitor our discharges of metals to water and measure other substances of concern. Terms for water discharges are stipulated through environmental permits according to national legislation where our operational sites are located.
| Discharges of substances to water, kg | 2019 | 2018 |
| COD (Chemical Oxygen Demand) | 10,770 | 9,230 |
| O&G (Oil and grease) | 700 | 170 * |
| N-tot (Nitric nutrients) | 390 | 380 |
| TS (Total Solids (TSS+TDS)) | 4,630 | 5,370 * |
| Discharges of substances to water, kg | 2019 | 2018 |
| Iron (Fe) | 460 | 600 * |
| Zinc (Zn) | 130 | 290 * |
| Nickel (Ni) | 50 | 90 * |
| Copper (Cu) | 20 | 20 * |
| Chromium (Cr) | 20 | 20 * |
| Lead (Pb) | 10 | 2 * |
| Cobalt (Co) | 20 | 1 |
| Arsenic (As) | 2 | < 1 |
| Cadmium (Cd) | < 1 | < 1 |